Viewing Schedule
You can view the details of a schedule by clicking on the hyperlinked name or by double clicking anywhere within a table row, except for the checkbox in the first column or the buttons in the Actions column.

Viewing a Sandfly Schedule
The schedule details page contains an action bar in the upper right corner with Activate / Deactivate, Run Now, Edit and Delete buttons. The body of the page displays sections of information depending on the schedule type:
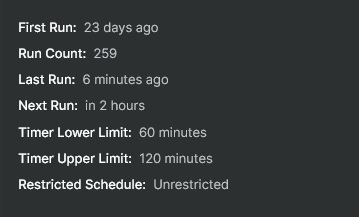
The Run Data section of any schedule type will show its assigned name and type, the lower and upper timer limits, restricted time window information, active state, the dates of its first, last, and next runs (all in UTC), and finally the number of runs, which increments by one each time it runs successfully.

Run Data Section
The Scan Settings section of a scan type of schedule will show its run priority, Include / Exclude host tags, types of sandflies that it will run, selection percentage of sandflies, and the setting for deletion of offline and inactive hosts.
The Discover Settings section of a discover type of schedule will show the list of provided IP addresses or hostnames, the login credential to use, the port for SSH, the name of the Sandfly queue, a list of any jump hosts, and finally any host tags to apply.
Updated 2 months ago
